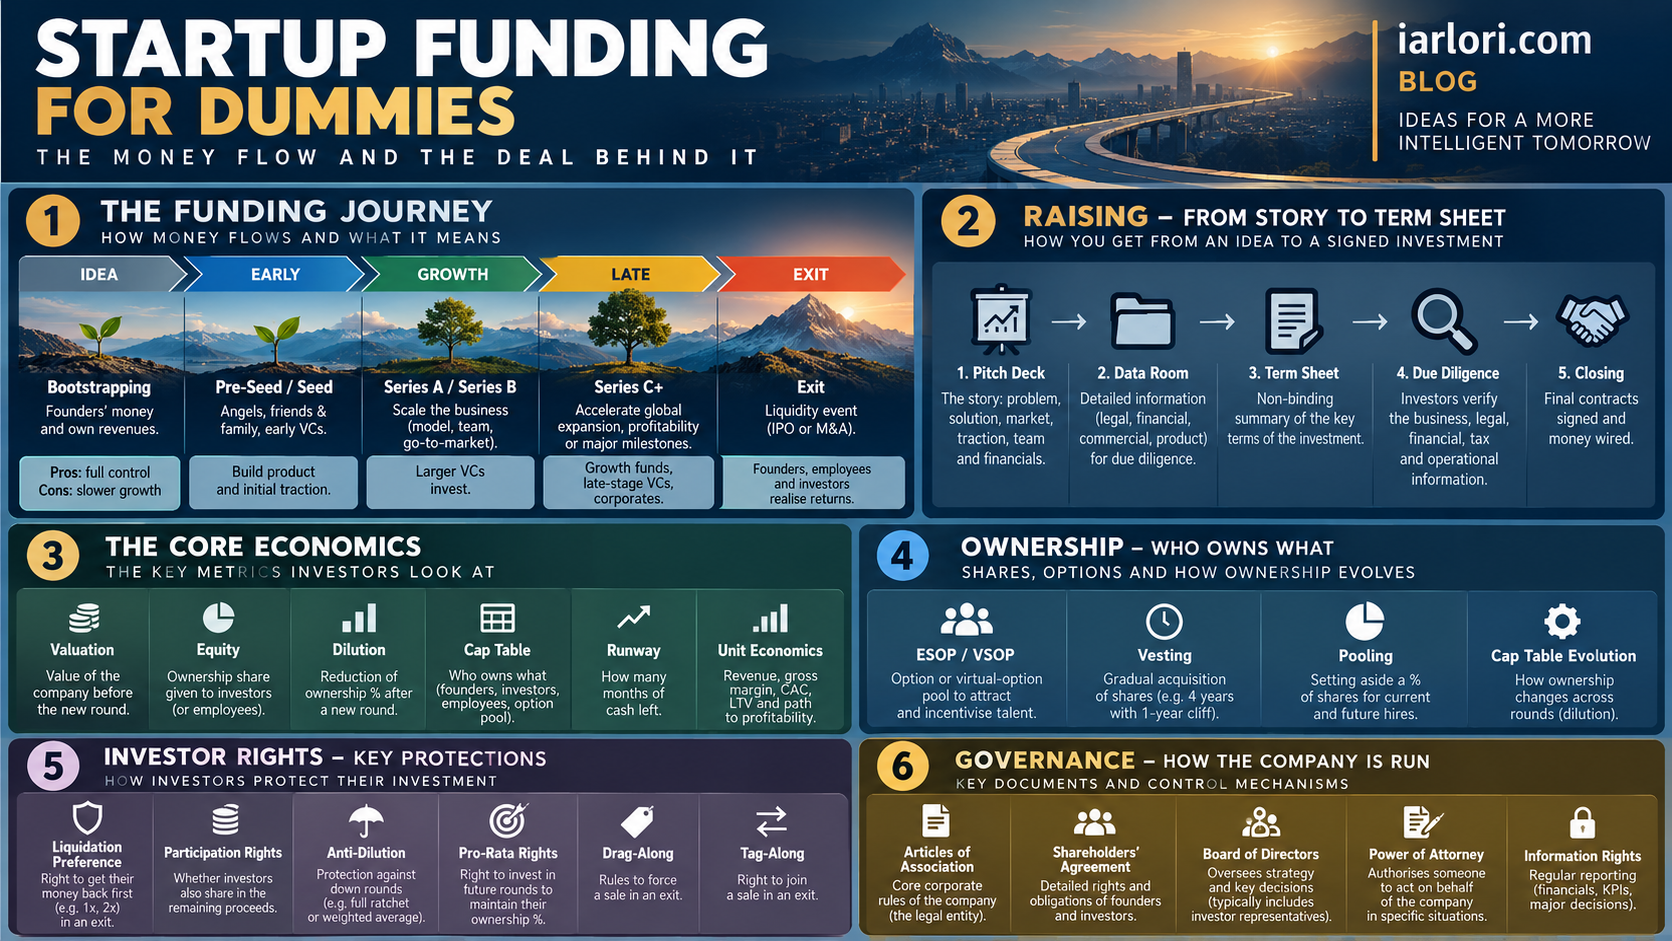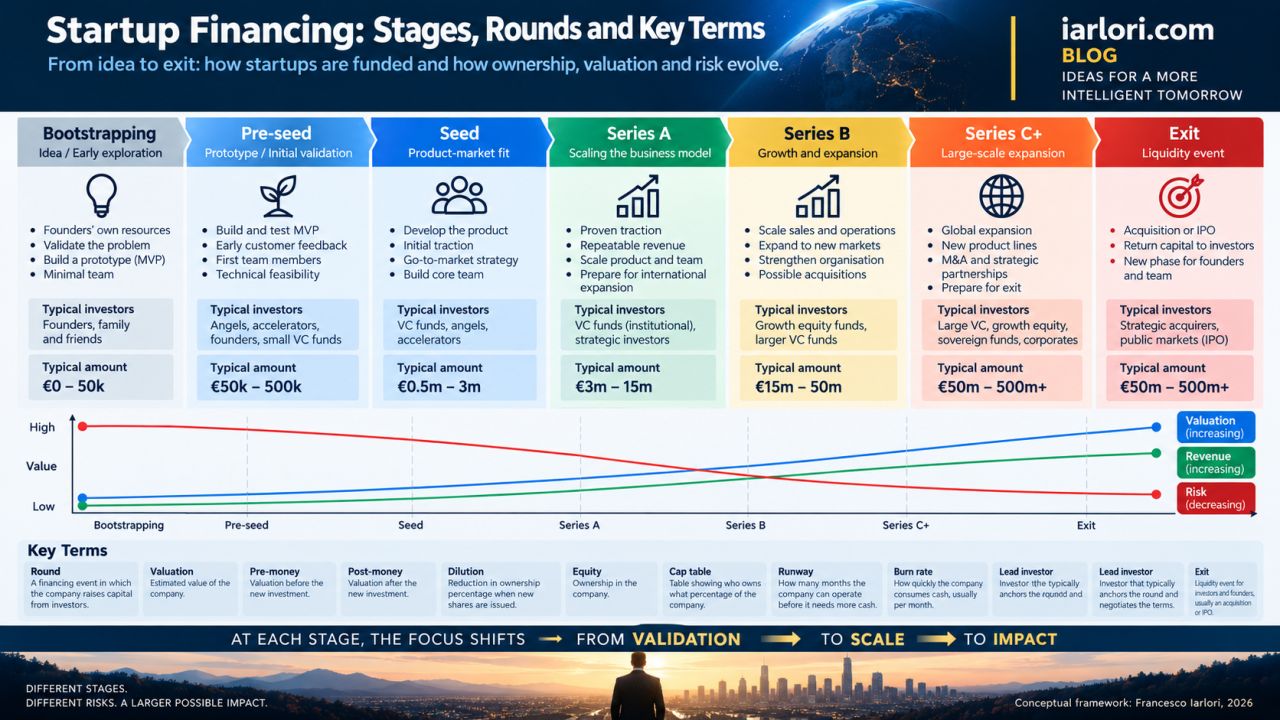
Remember the For Dummies books? Here is my one-picture version…
Sometimes I think we need the same approach for the vocabulary surrounding startups.
Pre-seed. Seed. Series A. Series B. Series C+. SAFE. Convertible note. Pre-money. Post-money. Dilution. Runway. Burn rate. Cap table…
If you work around innovation, AI or technology, you hear these terms constantly. But it is surprisingly easy to use them without seeing how they fit together.
So I tried to put the whole journey into one picture.
From bootstrapping to exit, the infographic shows not only the financing rounds, but how the company changes along the way – investors, capital requirements, valuation, revenue and risk.
And perhaps the most important point is not financial terminology at all:as a startup matures, the conversation moves from “Can this work?” to “Can this scale?” and eventually to “What value can it create?”
A small visual cheat sheet for the next time someone casually mentions a SAFE, post-money valuation or Series B over coffee.
The initial diagram omits several key elements, namely the term sheet and vesting provisions. In the revised version, I have also included the ESOP/VSOP (option or virtual option pool) and the data room.
The pitch deck is valuable, although it constitutes an artefact rather than a financing term.
The articles of association and power of attorney pertain primarily to legal and corporate mechanics and may be excessively detailed.
Furthermore, a significant category is absent: liquidation preference, pro-rata rights, anti-dilution provisions and, potentially, drag-along and tag-along rights. These become particularly pertinent once the focus extends beyond basic valuation and funding rounds.
So I extend the graphic with a small second layer:
RAISING → Pitch Deck → Data Room → Term Sheet
OWNERSHIP → Cap Table → ESOP/VSOP Pool → Vesting → Dilution
INVESTOR RIGHTS → Liquidation Preference → Pro-rata → Anti-dilution
GOVERNANCE → Shareholders’ Agreement → Articles → Drag/Tag